Introduction
Eating disorders (EDs), psychiatric disorders of irregular eating, have consequences in the social and mental life.1–3 Disordered eating attitudes result in long-term impairments, depression, anxiety4 and costs the highest mortality among the mental disorders.5 Moreover, eating disorder has been associated with fatigue and hormonal abnormalities that may result in menstrual irregularities and decreased bone mineral density.6,7
Albeit eating disorder is more prevalent in western countries, becoming predominant among non-western countries including South Asia. Evidence reported that 11.5% of students across South-East Asian countries were at risk for an eating disorder, ranging from below 10% in Indonesia, Thailand, and Vietnam to 13.8% in Malaysia and 20.6% in Myanmar.8 In Bangladesh, private university students showed 37.6% eating disorder risk.9 The outcome may differ in public university students, representing the mainstreaming middle-class students in this country, rather than from high-class wealthy families and studied in private universities.
Young adults, including university students (known as emerging adulthood), are the most common vulnerable group of disordered eating attitudes and behaviors.10 Most young adults stay away from home during this period of life and begin university education, thus increasing the chance of many mental and behavioral disorders.11,12 There are several factors associated with eating disorders such as age, sex, marital status, greater exposure to western culture, cultural transition and globalization, and health-related variables including BMI.13–15 A previous study among Bangladeshi private university students found several risk factors for eating disorders such as age, high religious involvement, overweight body perception, low body appreciation, cosmetic surgery, and current binge drinking.9 This study hypothesized that eating disorders are associated with sex differences and the students’ nutritional status (body mass index).
Given the university students are the most common vulnerable group of disordered eating attitudes and behaviors10 and remarkable variation among settings2,9,16,17 but, literature is absent regarding public university students and nutritional association, the investigators desired to explore the prevalence of eating disorder among public university students in Bangladesh. In addition, there may be a significant variation in rates and factors of eating disorders between private and public universities due to socioeconomic and cultural variations. Moreover, nutrition transition increased access to fast food, and greater exposure to western culture has been implicated in changing the lifestyle and food habits of individuals in Bangladesh, which may lead to eating disorders.18,19 Hence, we need a better understanding of the factors attributed to eating disorders among university students in Bangladesh. Therefore, this study aimed to investigate the prevalence and risk factors of eating disorders among public university students in Bangladesh.
Materials and Methods
Study Area
We conducted this research at Patuakhali Science and Technology University, Patuakhali, Bangladesh. This residential, public university is located about 38 km south of the divisional city (Barishal) and 270 km away from the capital city (Dhaka). Almost all the students lived as university residents.
Study Design, Participants, and Sampling
A cross-sectional study was carried out among university students from October to December 2019. We calculated 360 sample size from a single proportion test by considering a 5% margin of error, 95% Confidence Interval (1.96), and 37.6% overall prevalence of eating disorders in the university students of Bangladesh.9 For more precision, we enrolled five more participants of the calculated sample size. Then, the final response rate was 100% (n= 365).
Participants were considered eligible for this study if the following criteria were met: (i) only undergraduate students and (ii) residing in university dormitories (halls). We used two-stage cluster sampling with an equal allocation technique to select the participants. At first, we randomly selected the rooms of each hall. After that, a maximum of two students was selected randomly from each of the chosen rooms.
Data Collection Procedure
Before data collection, we informed all the students’ purposes, and the only interested one was recruited as our study subject. Trained investigators collected information on socio-demographic characteristics and eating attitudes from the participants through a self-reported pre-structured questionnaire. The questionnaires had three-part: socio-demographic characteristics, eating attitudes test-26 (EAT-26), and anthropometric assessment. The questionnaire was developed first in English, then translated into the local language at the time of data collection. The investigators checked all the filled questioners for completeness and accuracy. Anthropometric indices of the height, weight, and body mass index (BMI) of the participants were measured under the direct supervision of the investigators.
Measures
Anthropometric Assessments
Skilled investigators took all the anthropometric measurements using standardized procedures.20 All the procedures were performed in an isolated room in the halls, and participants were instructed to remove shoes and socks and heavy clothing or accessories. As the university had some strict rules for entering the halls, female research investigators took measurements of female participants and vice-versa. Participants’ weight nearest to 0.01kg measured by Electronic Personal Scale (Model: EB9062), while height by using non-stretchable tape to the nearest 0.1 cm. We calculated BMI as weight (kg)/height (m)2. According to the World Health Organization (WHO), BMI was classified into four groups: underweight (BMI < 18.5 kg/m2), normal weight (BMI = 18.5 – 24.9 kg/m2), and overweight (BMI = 25.0 – 29.9 kg/m2) and obese (BMI > 30 kg/m2).21
Eating Attitude Test-26
Eating disorders were measured using a validated EAT-26 tool composed of 26 items of three factors from subscales.22 Factor I is ‘dieting’ with thirteen subscales, factor II is ‘bulimia and food preoccupation’ with six subscales, and factor III is ‘oral control’ with seven subscales. For scoring the value six-point liker-type scale from ‘always’ to 'never used. For all items except item-26, a score of 3 was given for ‘always,’ 2 for ‘usually,’ 1 for ‘often,’ and 0 for ‘sometimes,’ ‘rarely,’ and ‘never. For item number 26; 1, 2, and 3 was given for ‘sometimes’, ‘rarely’ and ‘never’, respectively and 0 was given for ‘always’, ‘usually’, and ‘often’. Thus, a total score ranging from 0 to 78 was computed by summing all of the participants’ responses. A score of 20 or more is defined as at risk of eating disorders (unfavorable eating attitude) and below 20 as no risk of eating disorder. EAT-26 was previously validated by Pengpid et al. in Bangladesh.9 The internal consistency was good in the present study (Cronbach’s alpha 0.87).
Statistical analysis
Data were analyzed with Statistical Package for Social Science (SPSS) version 23.0. Descriptive and analytical statistics, including bivariate and multivariate analysis, were performed. All variables with a p-value of less than 0.2 in bivariate analysis were entered into a multiple logistic regression model. The strength of association between dependent and independent variables was measured by odds ratio with a 95% confidence interval.
Ethical Consideration
The study protocol reviewed and approved by the Research Ethical Committee (REC) of Department of Food Microbiology, Patuakhali Science and Technology University, Bangladesh (Approval Number: FMB: 09/10/2019:03). We obtained written consent from all the study participants.
Results
The socio-demographic characteristics of respondents represent in Table 1. Among all the participants, males and females were almost equally distributed (male: 50.4% and female: 49.6%). More than half (57.5%) of the students were 17-21 years of age, where the mean age was 21.08 (SD = ±1.69), and the majority of the students (81.1%) belonged to the Muslim family. The overwhelming majority of the students (88.5%) were from a middle-class family, in which half (50.1%) of all the students were from a lower-middle-class family. Out of all, 19.2%, 34.8%, 20.5%, and 25.5% of students were studied in their 1st year, 2nd year, 3rd year, and 4th year, respectively. In relation to the body mass index, about 65% of students had average body weight, 11.5% had underweight, and 23.6% had above the average body weight (Table 1)
Table 2 represents the prevalence of eating disorders based on EAT-26 scores. The mean (± SD) EAT-26 score was 16.28 (± 9.63). Besides, the mean (± SD) score of the EAT-26 subscales, i.e., Dieting, Bulimia and Food Preoccupation, and Oral Control were 8.24 (± 6.05), 2.92 (± 2.66), and 5.12 (± 3.31), respectively.
The prevalence of ‘eating disorder risk’ among the students was 23.0% (95% CI: 18.6 to 27.4). About one-fourth (24.4%) of students responded “always” in the statement of “I am terrified about being overweight.” Thirty percent of the students were always preoccupied with a desire to be thinner. Only 7.9% and 11.2 % of students marked “always” and “often,” respectively, for the item “Find myself preoccupied with food.” Besides, 20.3% and 9.3% of students were for “I am preoccupied with the thought of having fat on my body” always and usually, respectively. Apart from these, about 20% and 11% of the students were for “Feel that food control my life” always and often, respectively (Table 2).
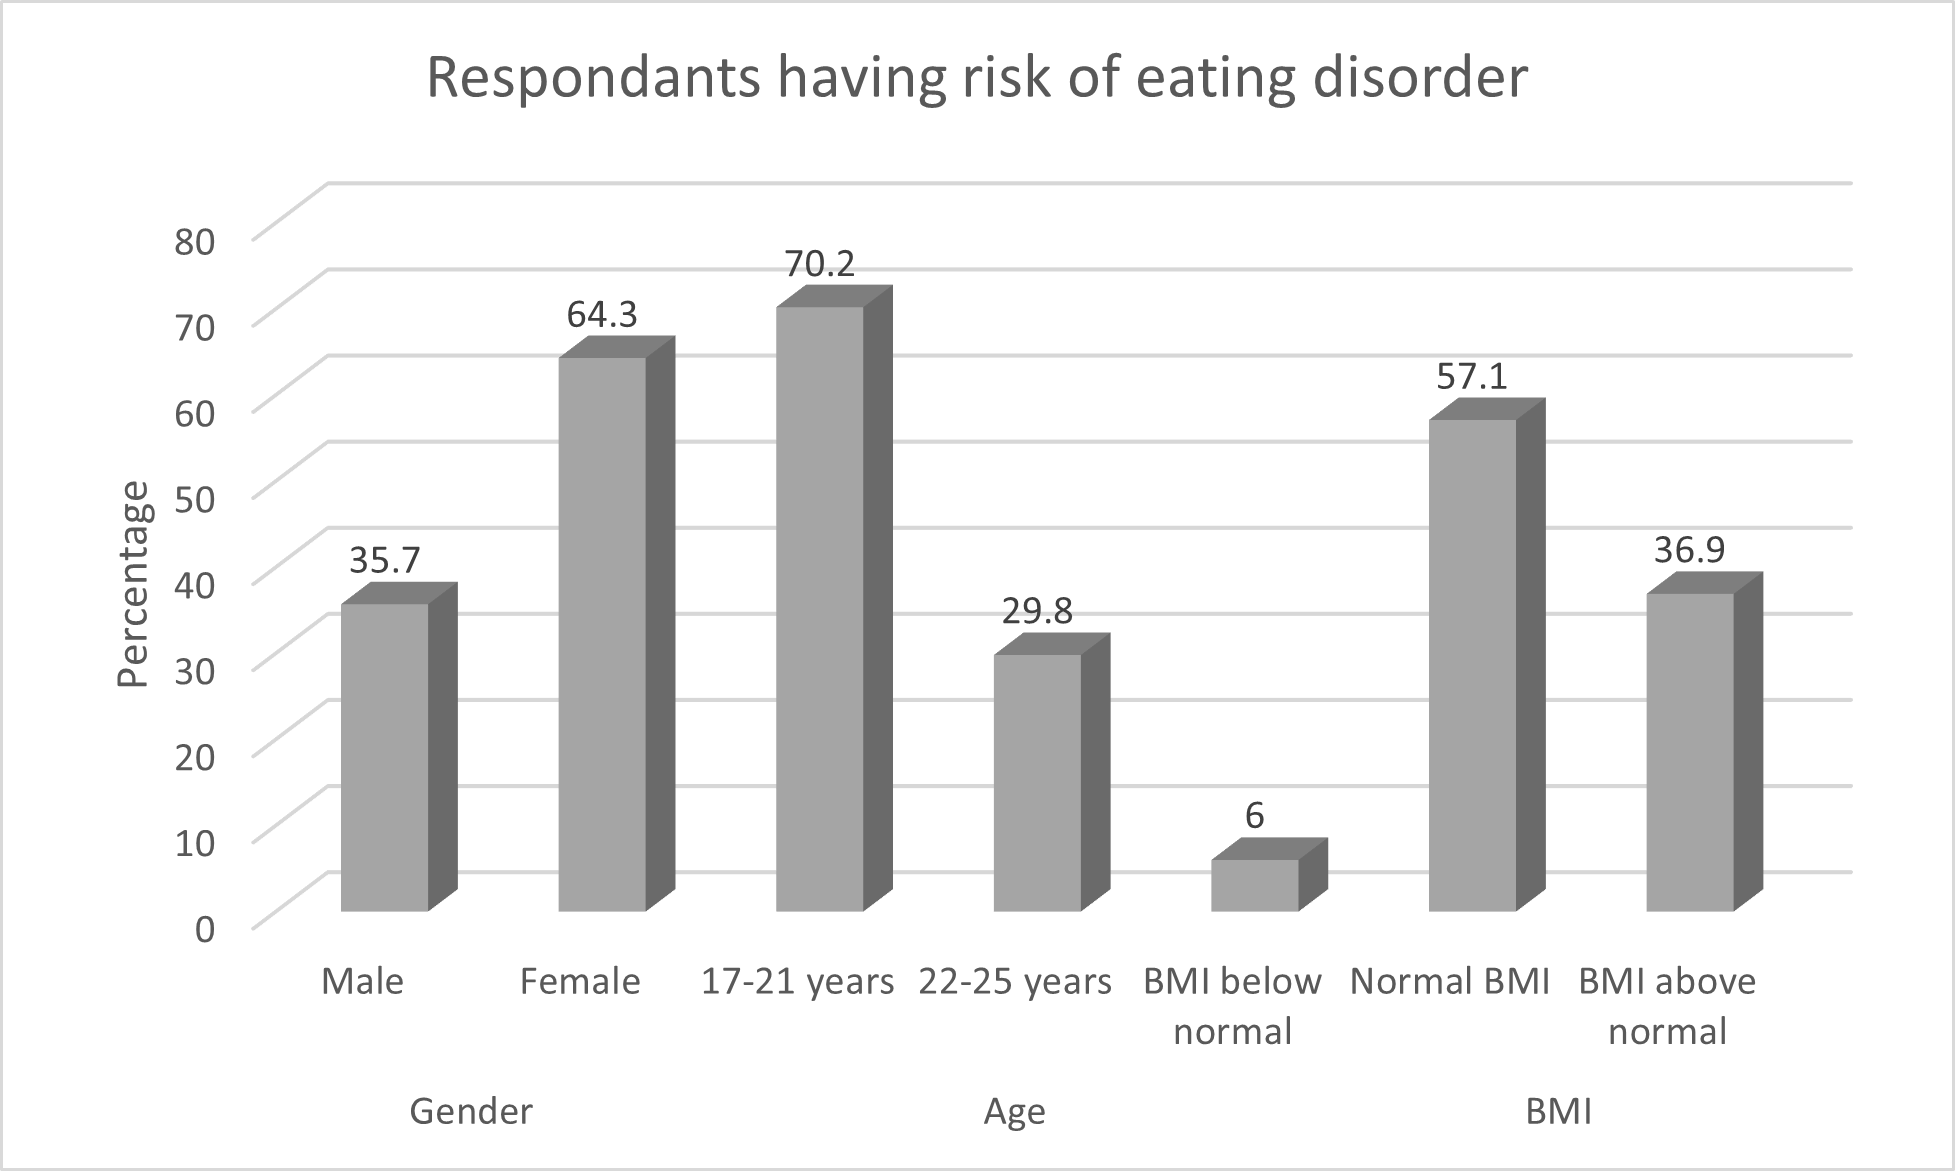
Out of reported 84 eating disorder risk students, 54 (64.3%) were females and 30 (35.7%) were males (p= 0.002). Disordered eating attitudes were found more in aged between 17-21 years (70.2%), while only 25 (29.8%) were from the age group 22-25 years (p= 0.007). More than half (57.1%) of the students with normal BMI values showed more eating disorder risk among all eating disorder risk students. In the abnormal BMI range, 31 (36.9%) students with BMI above normal range showed eating disorder risk (Figure 1).

In bivariate analysis, gender, age, family status, and body mass index were found with a p-value of less than 0.2. However, the findings of binary logistic regression showed that student’s age, gender, and body mass index were significantly associated with the risk of an eating disorder. The fitness of the adjusted regression model was proved by the Hosmer and Lemeshow test (chi-square= 5.251; df= 8; p= 0.642). The odds of developing disordered eating attitudes were 2.4 times higher in females than males (AOR = 2.4, 95% CI: 1.4 to 4.2). Besides, the odds of developing an eating disorder risk were two times higher in students who had an aged range between 17-21 years compared to those who had aged above 21 years (AOR = 2.0, 95% CI: 1.2 to 3.6). However, the risk of developing an eating disorder was higher among overweight (AOR = 4.9, 95% CI: 1.6 to 14.9] and obese (AOR = 7.7, 95% CI: 1.9 to 31.4) students as compared to underweight students (Table 3).
Discussion
The present study investigated the prevalence and risk factors of eating disorders among students in a public university in Bangladesh. Students’ gender (being female), age (younger adulthood), and body mass index (being overweight or obese) were found as potential determinants of eating disorder risk in this public university.
Our study demonstrated that 23.0% of the students were at risk of eating disorders, similar to medical students in Pakistan.2 However, this prevalence was higher than the previous studies among university students in India (4%),16 Malaysia Sarawak (13.7% females, 5.6% males),17 and China (3.2%–9.9% in females and 1.2%–2% in males).15,24 This observed variation might be due to Bangladesh’s economic transition, greater exposure to western culture, and media exposure promoting western beauty and lifestyle standards.13,25 Moreover, we found a lower prevalence of eating disorder risk than a previous study conducted in Bangladesh among private university students (37.6%).9 This discrepancy might be due to their family background, as most of the private university students came from more affluent families than a public university. Their way of living is different and has more scope to adopt with western culture. On the contrary, the current study reported that most students came from a lower-middle-class family who might make this variation. Further comparative intervention or longitudinal studies among these two types of university students (public and private university) are highly recommended to understand the mechanism of developing an eating disorder.
A previous study showed disordered eating attitudes had been associated with gender.26 This study reported female students were more likely to have an eating disorder risk than male students, which support the finding of previous investigations.14,17,24 Indeed, females are more concerned about their physical appearance, body image, body weight, and beauty, which might lead to disturbed eating attitudes and behaviors. Besides, their desire to be thinner and slim made them susceptible to develop unfavorable eating habits. Though the risk of developing eating disorders was more common in females, a high prevalence was found among males, showing that these disorders have increased among boys.27
The current study found that younger adults (aged 17-21 years) were more likely to be vulnerable to eating disorder risk than older students. A similar finding was reported in previous studies.9,28,29 A plausible explanation for this finding is that younger-aged students have more freedom to their food choices and lifestyle due to their behavioral transitions from living with family to living with peers on campus or living alone.
We found that students being overweight and obese were more likely to have an eating disorder risk. These findings supported other studies.2,14,29 Our research reported that most students had normal body weight, more than 20% of students had a BMI above the normal range. Interestingly, we found a statistically significant relationship among this portion with disordered eating habits. Moreover, our findings revealed that of the students with normal body mass index, 20.25% still suffered from eating disorders as by EAT-26 (n = 48/237). Indeed, the onset of eating disorders can be a psychological basis. Even individuals with normal body mass index can have a likelihood of these disorders.2 Students who are overweight and obese tend to have a higher risk of eating disorders to achieve a lean bodily image which might pose to disordered eating attitudes.
Previous studies showed religiosity was correlated with eating disorders.9,30 This study found no significant association between eating disorders and religion. We considered only religious types such as Hindu, Muslim, etc., rather than the degree of religiosity they involved, which might explain this variation. Also, this study failed to make a significant association with family status, which was similar to another study.9
Strengths and limitations
This study has several strengths. It was the first study to explore the prevalence and determinants of eating disorder risk in a sample of Bangladeshi public university students. Therefore, the present study’s findings can be used as baseline characteristics regarding eating disorders among public university students. Moreover, this study used a widely validated tool (EAT-26) to screen for eating disorder risk. However, the study was not free from limitations. This cross-sectional nature of the study could not be generalized to the results into the whole country. As we administered self-reported questionnaires, there was a chance of research bias. This research was limited to self-administered questionnaires rather than a clinical diagnosis to identify eating disorders.
Conclusions
About one in four students reported at risk of eating disorders in this public university in Bangladesh. Younger adulthoods, females, and overweight and obese students were potential risk factors for developing unfavorable eating attitudes and behaviors. Early screening and identification of these risk factors might be conducive to understand the onset of eating disorders and preventive measures. In addition, the findings can be used to scheme health awareness campaigns to prevent the risk of eating disorders among Bangladeshi university students. University authorities should develop an educational program targeting students’ eating behaviors, focusing on the importance of healthy eating habits and the consequences of eating disorders. Hence, a psychological interventional study targeting the improvements of eating attitudes and behaviors at the university level is highly recommended to halt the future burden of eating disorders. Further intervention programs and longitudinal cohort studies incorporating large, diverse samples of Bangladeshi university students are required to determine the causal pathways of eating disorder risk.
Authors’ contributions
Study concept and design, data analysis and drafting of the manuscript: MHAB, SA; revision of the draft manuscript for important intellectual content: AS, SK, TRD & SS; data collection, management and data entry: MFD, MRT; Principal investigators and review final draft: MSIK, and all authors approved the final manuscript.
Conflict of interest
The authors declare that they have no conflict of interest.
Acknowledgements
We thank our study participants who humbly responded our all questions and gave their valuable time. Moreover, the authors are highly appreciating the contribution of Joyshree Mondol, Morium Tuz Marufa, Ishrat Jahan, Mohammed Khaleduzzaman and Md. Abu Sofeun (Students of Faculty of Nutrition and Food Science, PSTU) during data collection periods.
Funding
None.